
Site-level Leak Detection, Quantification and Emission Mapping
Industrial sites face increasing pressure to reduce fugitive emissions, comply with evolving regulations, and improve operational efficiency. We provide high‑accuracy, site‑level (top‑down) measurements that locate, quantify, and interpret emissions across large and complex areas. Our approach supports compliance with EU 2024/1787, OGMP 2.0, and EN17628:2022, while helping you reduce material losses, avoid penalties, and strengthen sustainability performance.
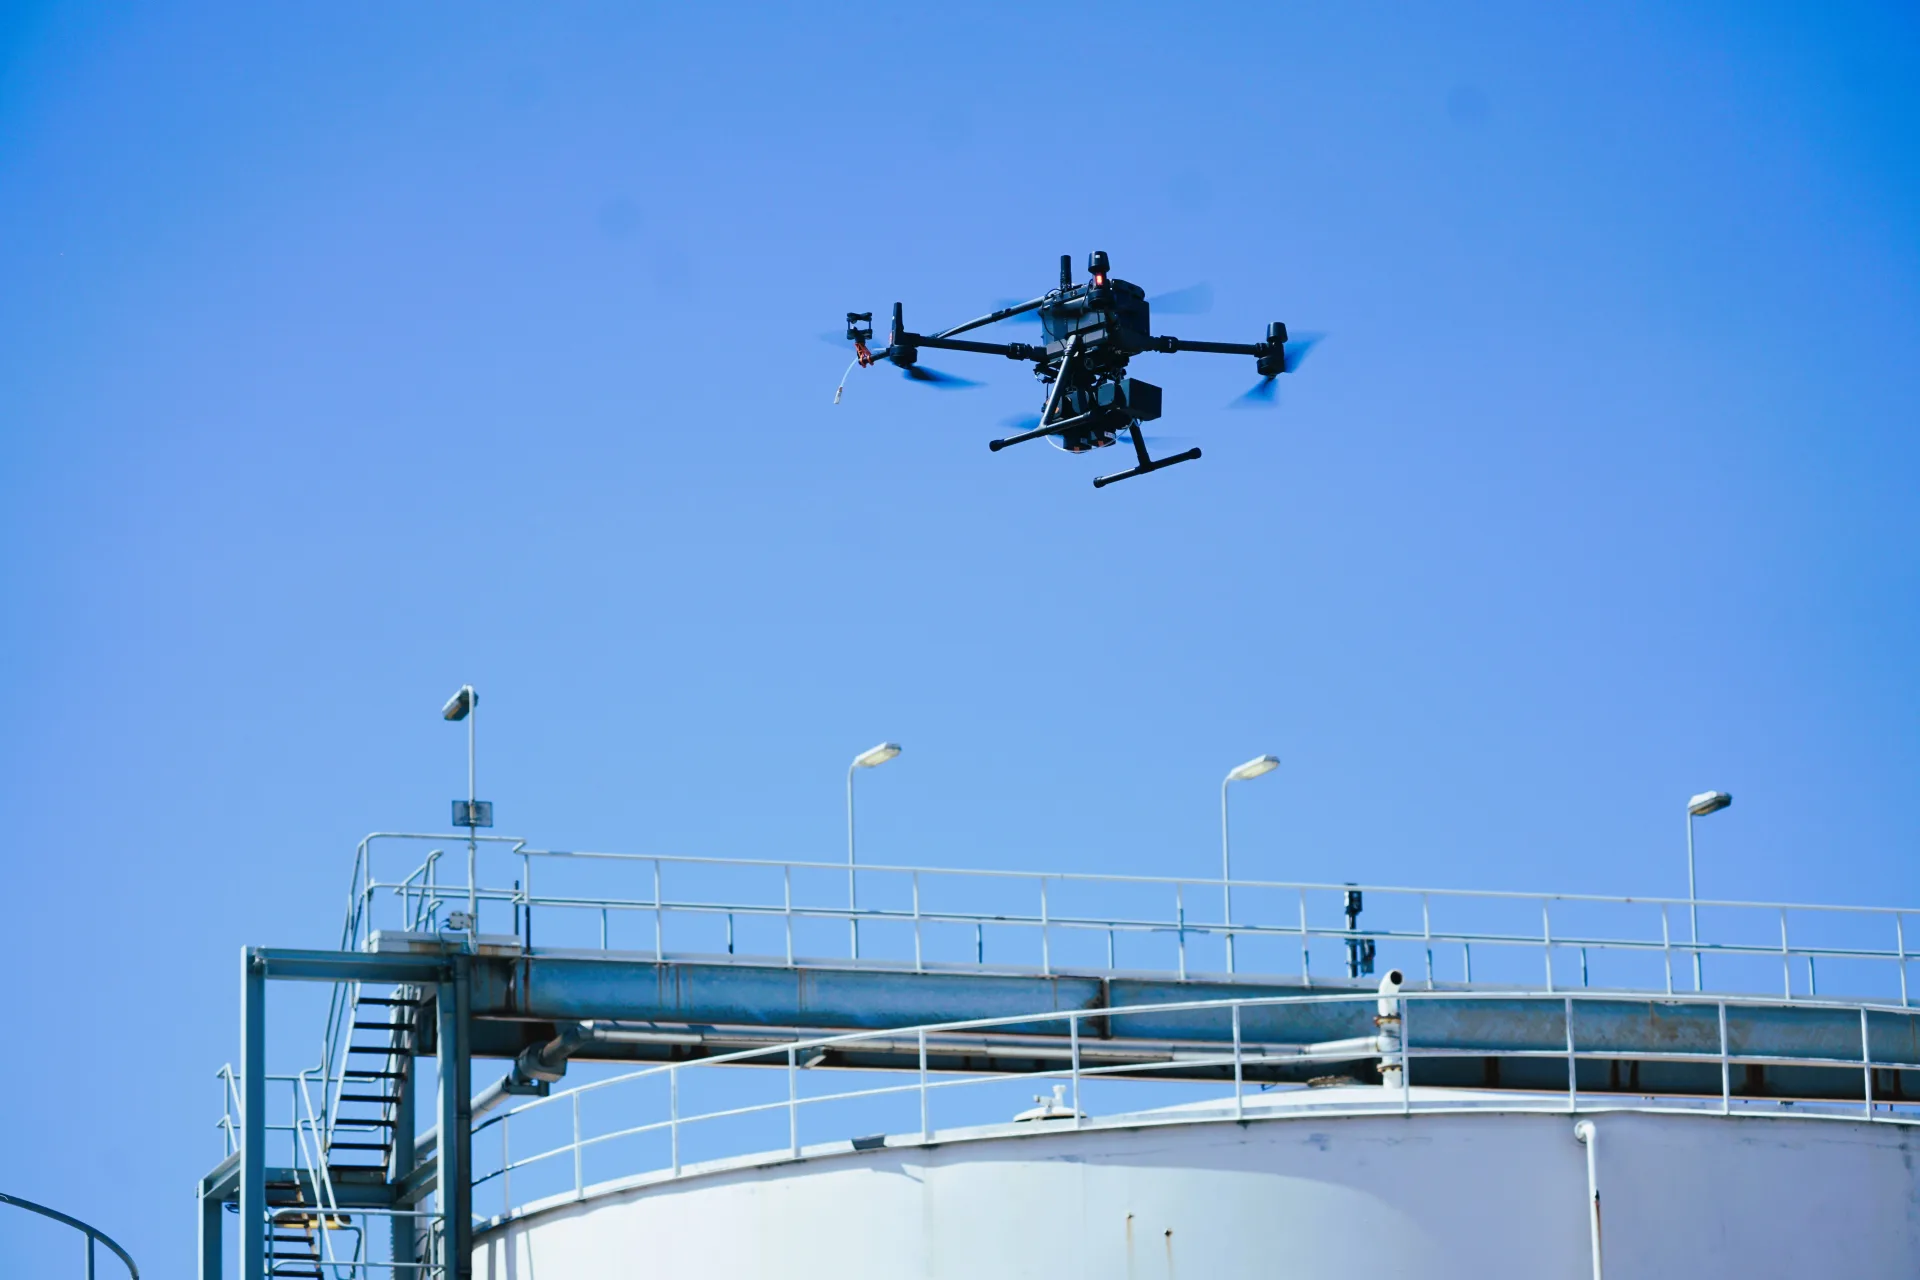
Site‑Level Emission Detection, Quantification & Dispersion Analysis
What We Deliver
- Pinpointed leakage locations across wide industrial areas
- Quantified emission volumes with validated accuracy
- Real‑time and continuous monitoring options
- Dispersion and dilution insights for understanding off‑site impact
- Comprehensive reporting for process development, maintenance, and regulatory use
Every detected and fixed leak translates into long‑term savings, improved safety, and reduced environmental impact.
How We Measure: A Proven, Collaborative Approach
Planning with Your Team
Each project begins with a jointly developed measurement plan. Together, we identify potential emission sources, site structures, and operational constraints such as ATEX zones. This ensures safe operations and optimal measurement paths for accurate source localization.
Advanced Quantification Methods
We apply multiple algorithms—including Reverse Dispersion Modelling and Mass Balance—selecting the most suitable one for your site layout, source characteristics, and environmental conditions. Our technology detects methane emissions down to 10 g/h, validated through controlled test releases. All results include dynamic, source‑specific error margins.
Modular, Multi‑Compound Measurement
Our systems measure methane, ammonia, VOCs, benzene, and particulate matter, with the flexibility to add compounds based on your needs. As sensor technology advances, so does the precision of our concentration and mass‑flow reporting.

Market-leading technology
Whilst our measurement capability is already market-leading, we continue to develop and innovate for us to ensure that the best available technology is at your disposal.
Area Mapping & Emission Fenceline Techniques
Area Mapping
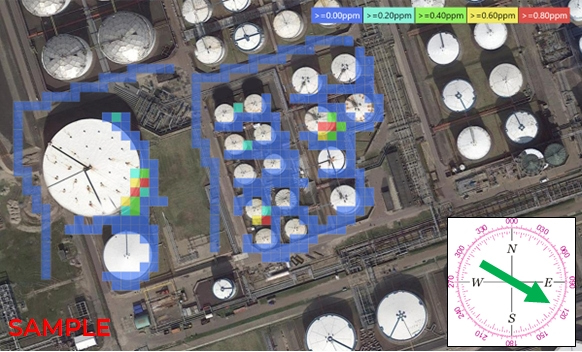
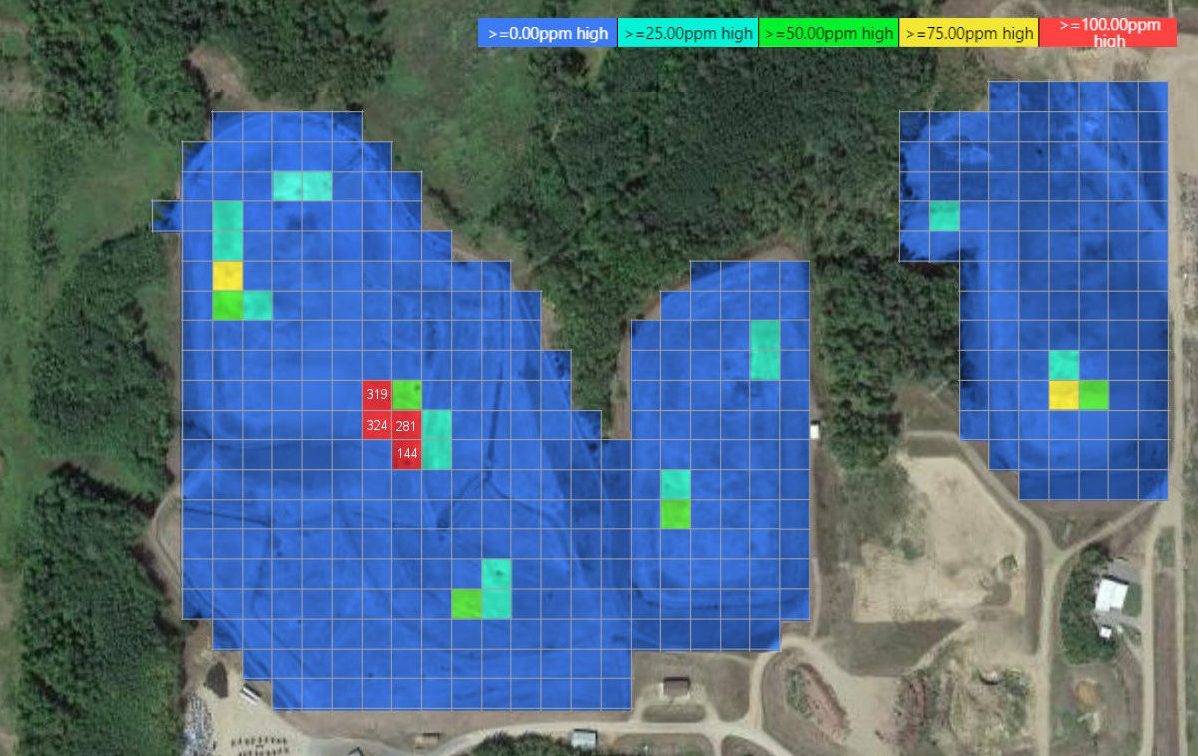
We systematically map emissions across your site and visualize them as choropleth emission maps, overlayed on satellite or infrastructure imagery. This provides a clear, repeatable overview of emission hotspots and their intensity.
Emission Fenceline
Where drone operations are restricted, we perform downwind measurements at multiple altitudes and distances. Comparing downwind and upwind data reveals source areas and quantifies the site’s overall impact on surrounding air quality.
These techniques together provide a complete, high‑resolution picture of fugitive emissions and their behaviour.
Continuous & Real‑Time Monitoring for Process Optimization
We offer both continuous monitoring and targeted single‑phase measurements:
- Single measurements capture emissions during specific process phases or environmental conditions.
- Recurrent measurements reveal how changing conditions influence emission behaviour.
- Long‑term monitoring with semi‑fixed setups provides the clearest view of how process variables affect airborne emissions over time.
Real‑time data enables immediate feedback during operational changes, supporting process optimization and early detection of anomalies.
Site-Level Measurements with Granularity
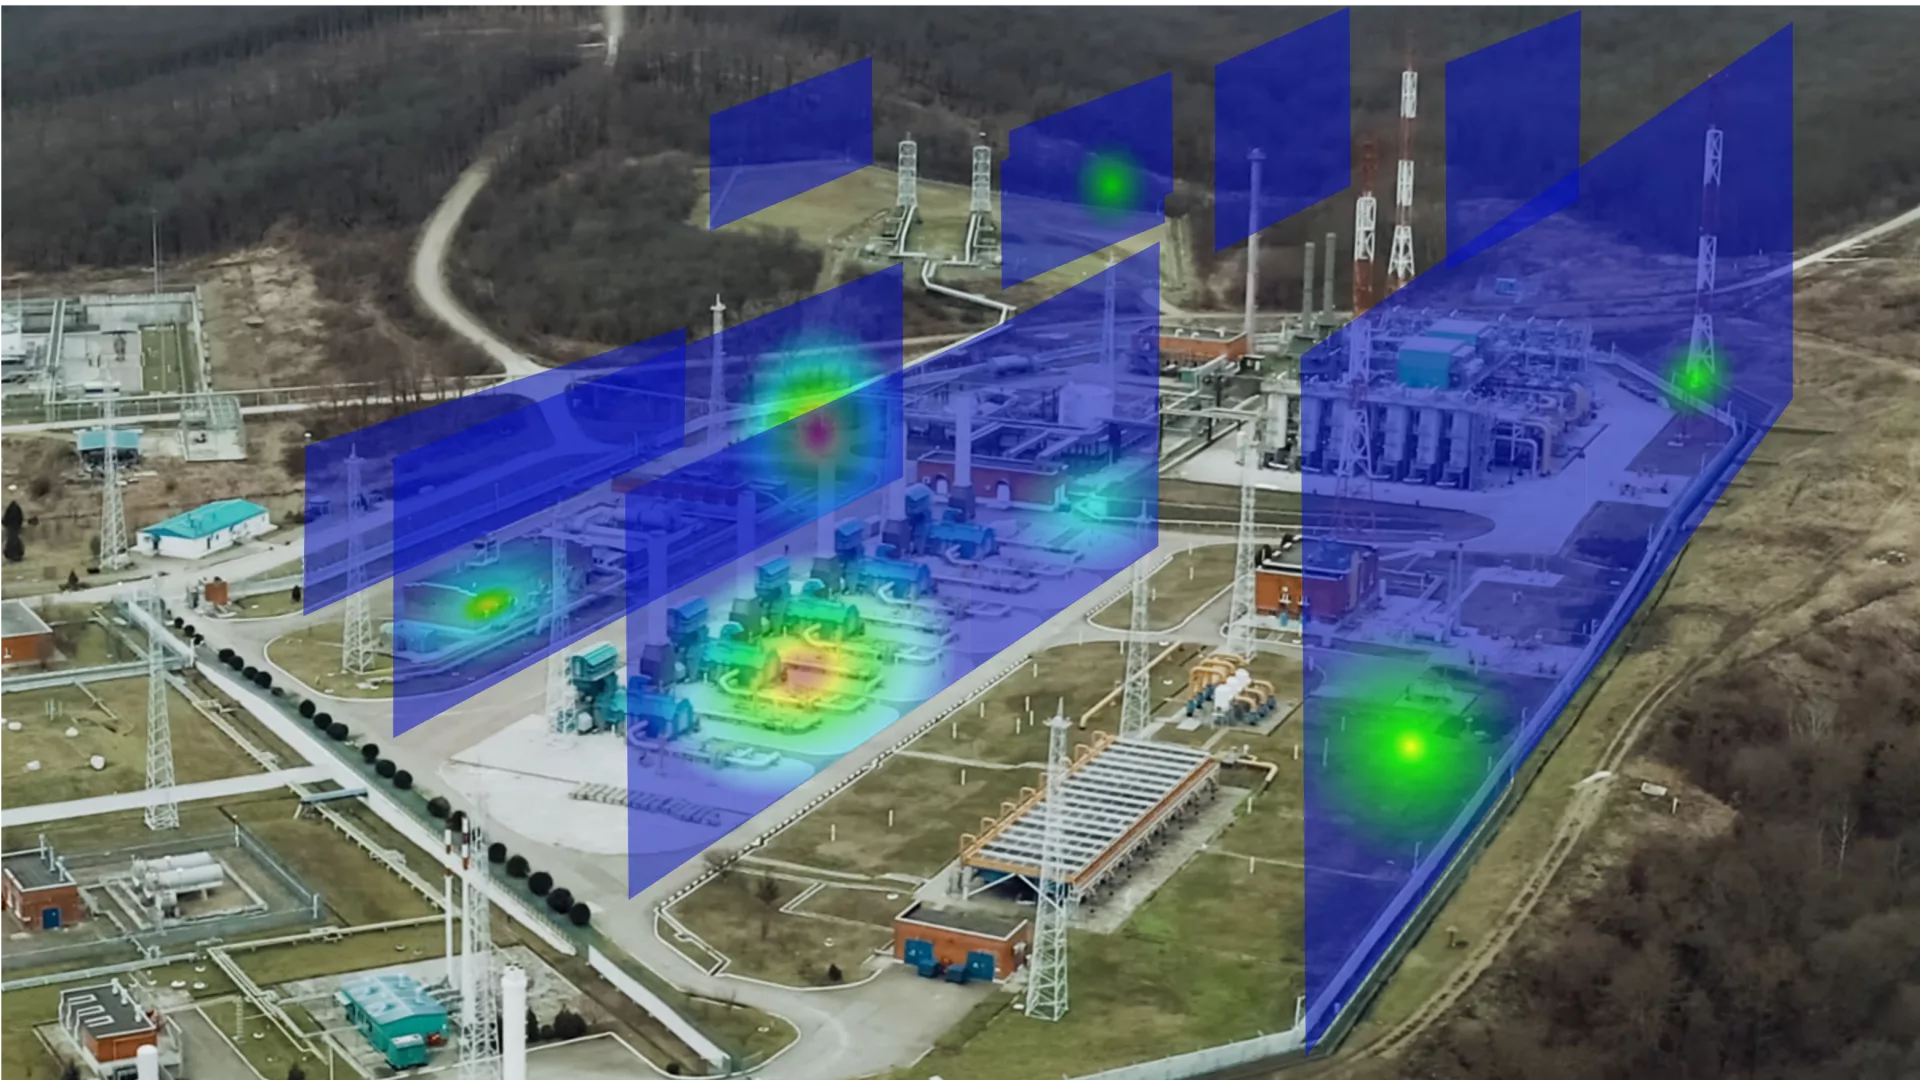
The spatial granularity of our results provides the definitive bridge between bottom-up inventories and site-level results. By visualizing emissions in 3D, we remove the doubt inherent in aggregate totals, pinpointing whether plumes originate from elevated vents or ground-level leaks. This clarity simplifies the reconciliation process, providing a transparent "why" that satisfies both internal audits and regulatory standards.
Beyond compliance, this data serves as a roadmap for targeted maintenance. By identifying hotspots with precision, you can prioritize high-impact repairs instead of conducting exhaustive facility-wide inspections. This approach transforms monitoring into an active operational tool, minimizing downtime, maximizing product recovery, and providing the verified evidence needed to meet Net Zero targets with confidence.
Independent Validation & Demonstrated Expertise
Our methods have been independently benchmarked, including in a two‑phase project by the European Gas Research Group (GERG) evaluating top‑down techniques within the OGMP 2.0 framework. In the first phase, our approach outperformed all other drone‑based methods and advanced to the second phase. These campaigns refined our understanding of hyperlocal wind behaviour and strengthened our technological edge.
Clear Results, Ready for Action
Preliminary findings can be reviewed on site, and final results are delivered in a comprehensive report that supports:
- process development,
- maintenance planning,
- comparison with calculated emission values,
- regulatory reporting,
- communication with internal and external stakeholders.

ISO 17025
We're the only lab-accredited, global provider of site-level methane quantification, flare combustion efficiency (FCE) and flare methane destruction removal efficiency (DRE) analysis.